Desktop Guide
Dashboard
Understand workspace status, project counts, queue state, storage, engine health, quick actions, and recent activity.
What This Feature Does
The Dashboard shows project counts, video/clip activity, active and completed jobs, queue status, storage/engine status where available, quick import actions, and recent projects.
Why Users Need It
It is the fastest place to confirm the app is ready and see what work is currently active.
Where To Find It
Open ZarachClipper -> Dashboard.
Before You Start
- Open app
- Wait for status refresh
Step-by-Step Guide
- Open Dashboard.
- Check project and job counts.
- Confirm Engine Status is Ready.
- Review processing queue preview.
- Use Upload Video or Import Link for new work.
- Open recent projects to continue previous work.
Screenshot Section
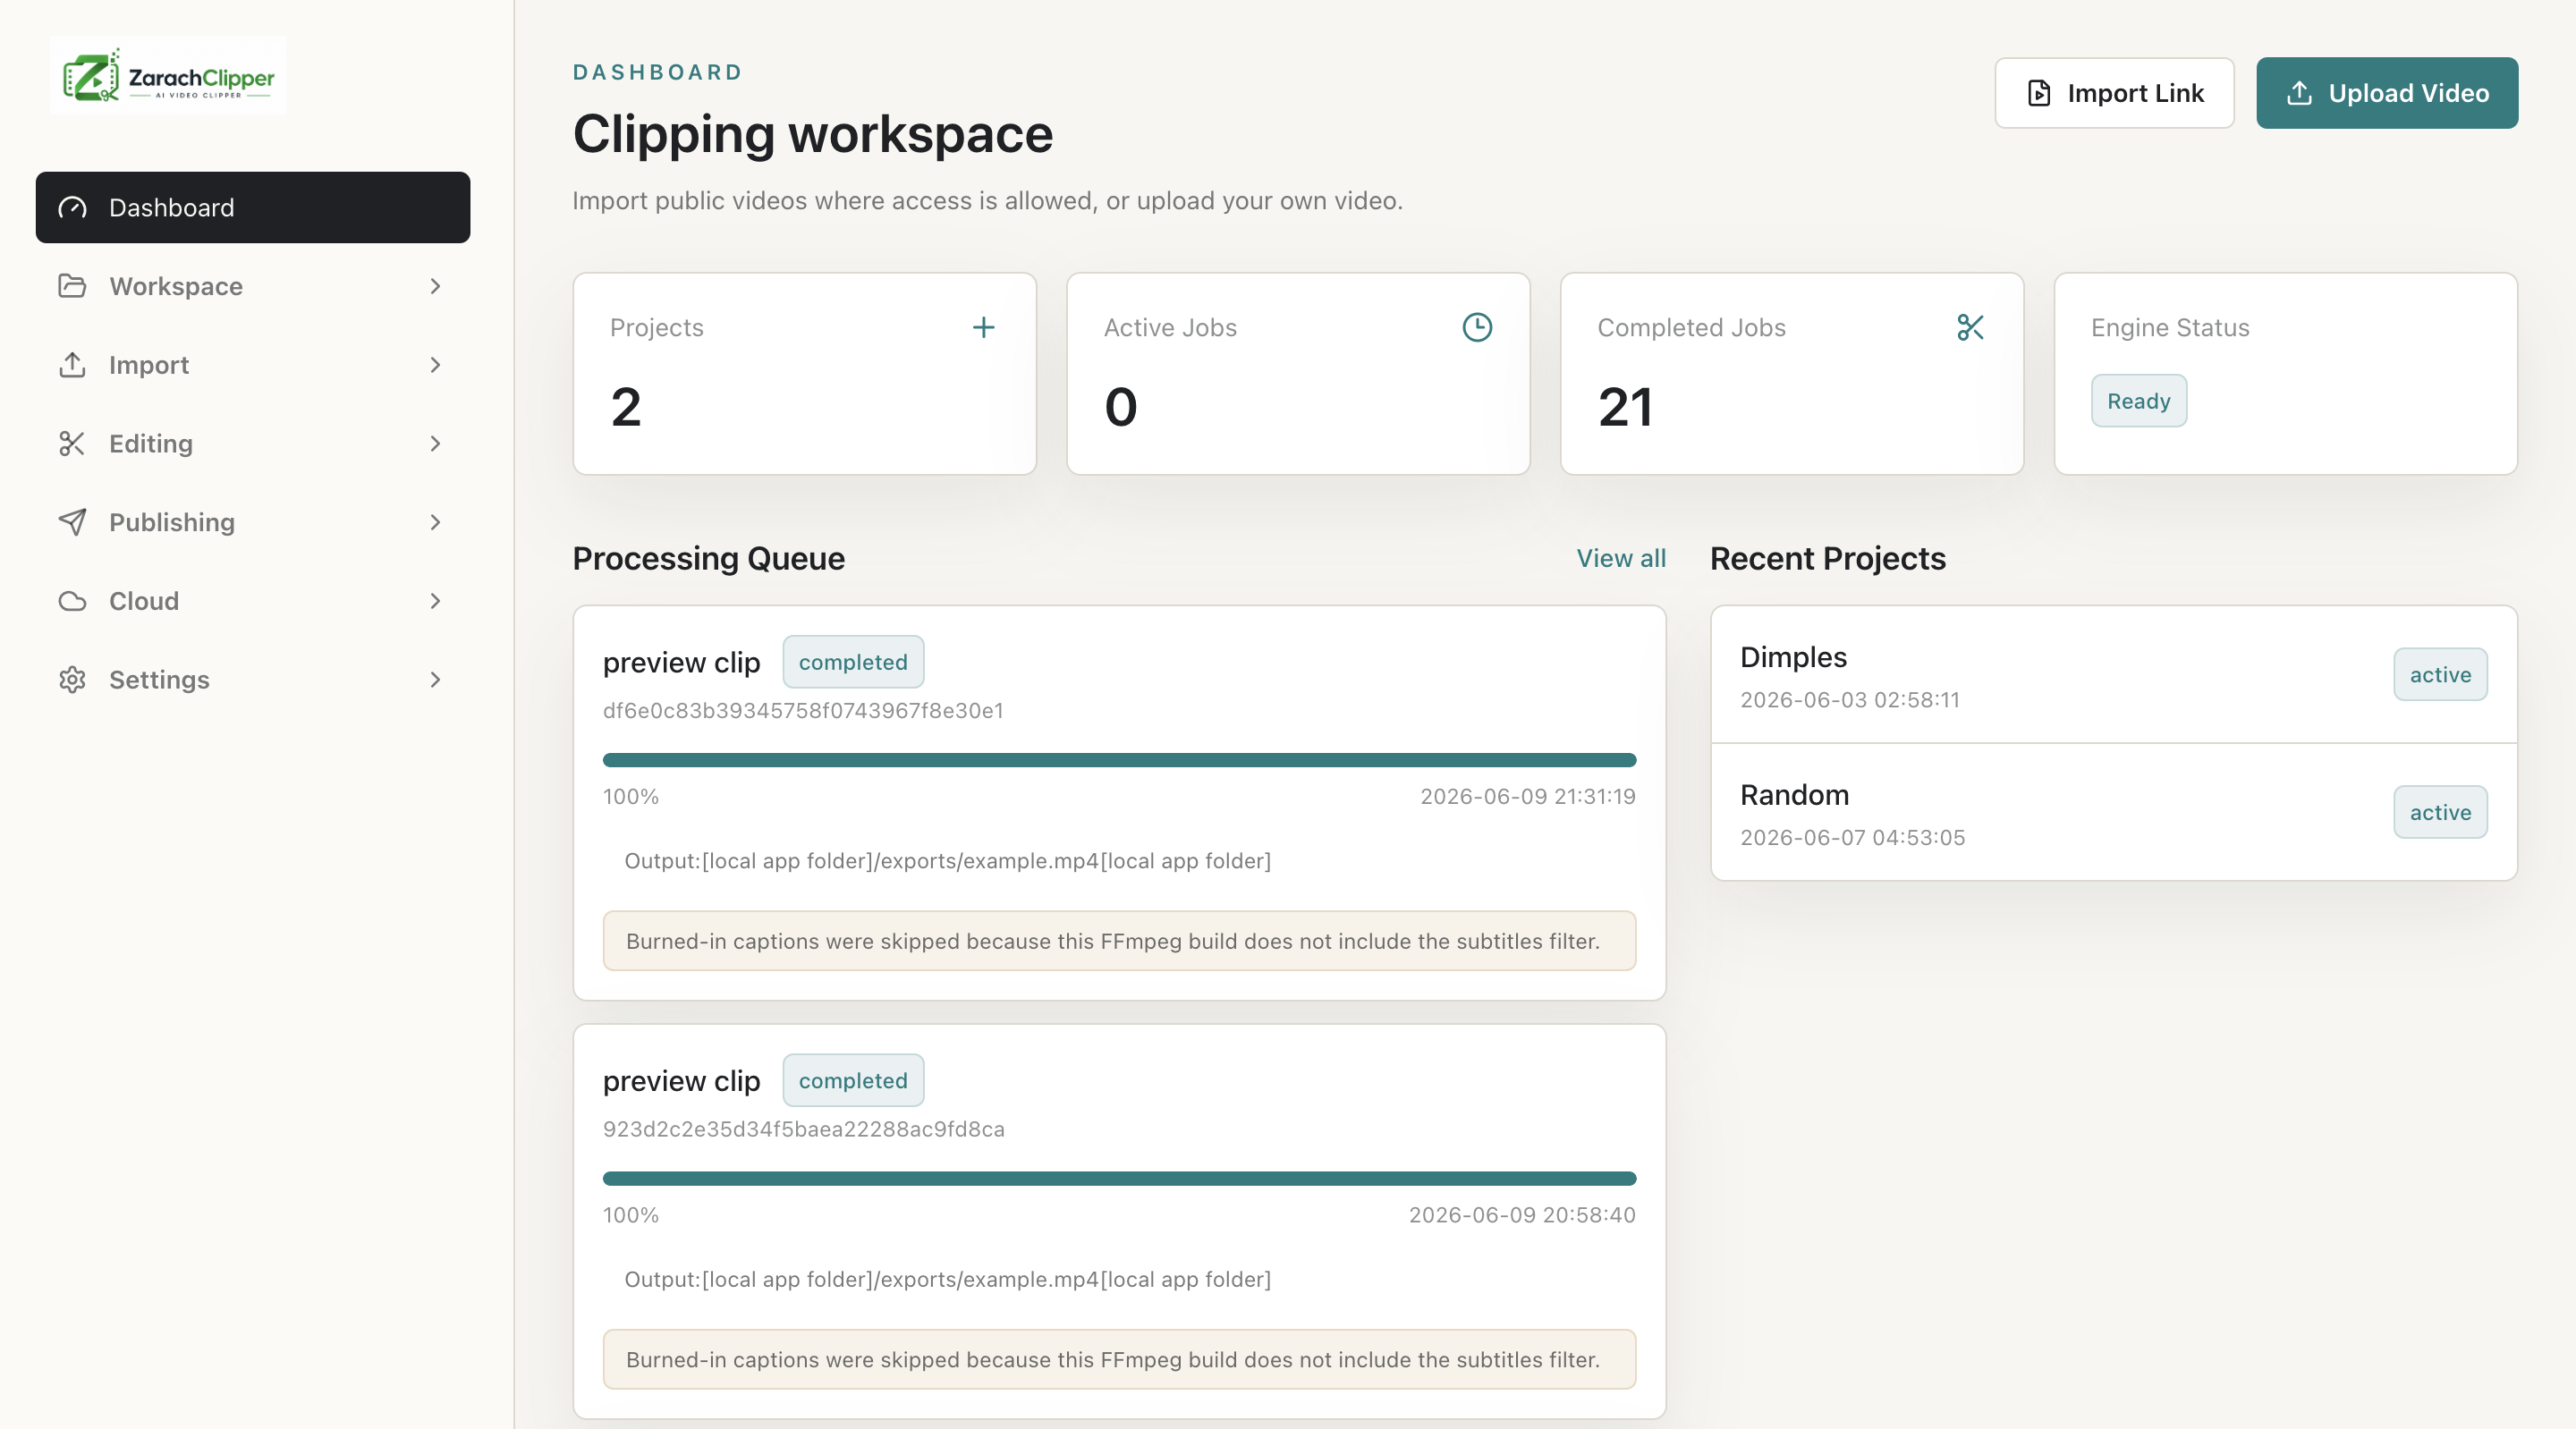
What To Check On The Screen
- Engine status is ready
- Queue reflects current jobs
- Recent activity makes sense
Expected Result
The user knows whether the workspace is healthy and where to continue.
Common Mistakes
- Starting imports while engine is offline
- Looking for detailed errors on the dashboard instead of Error Logs
Troubleshooting
If a job is stuck, open Processing Queue. If engine is offline, open Settings.